Workspaces
Saveable analysis canvases over a model's scenarios — described to RIA, planned as a suite, or started from a template.
A workspace is a saveable canvas of widgets over one model's scenarios. The landing screen's own summary: "Saveable analysis canvases. Describe what you want, let RIA propose one, or open an existing workspace."
Open Workspaces from the left rail while a model is active, or go to /workspaces for every
workspace you can see.
The landing screen
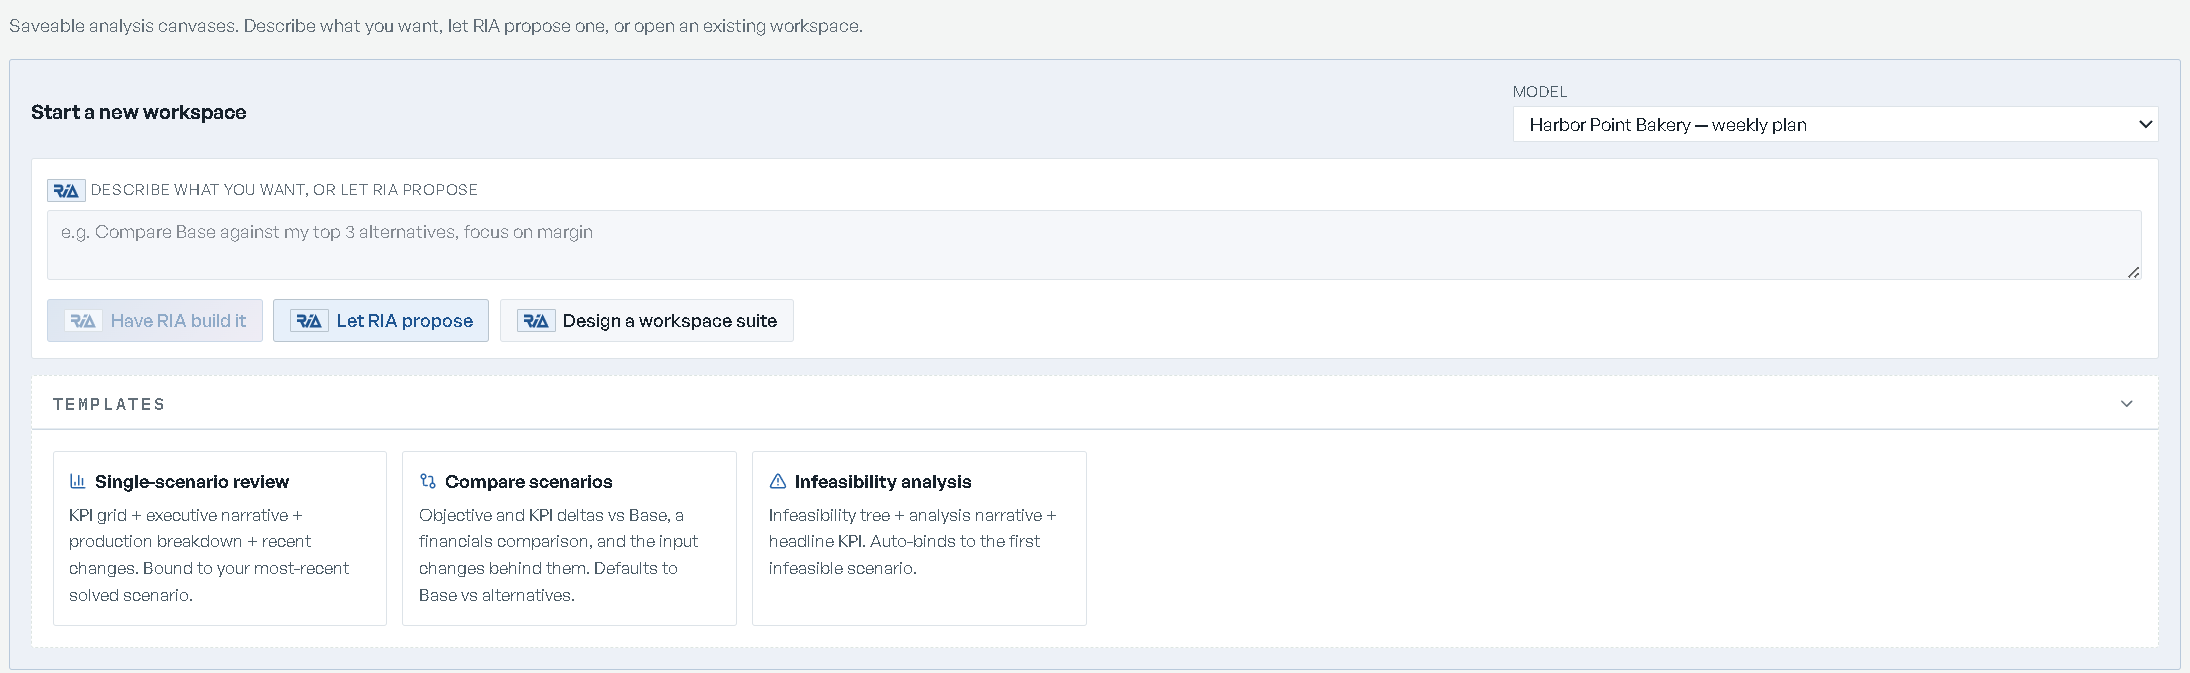
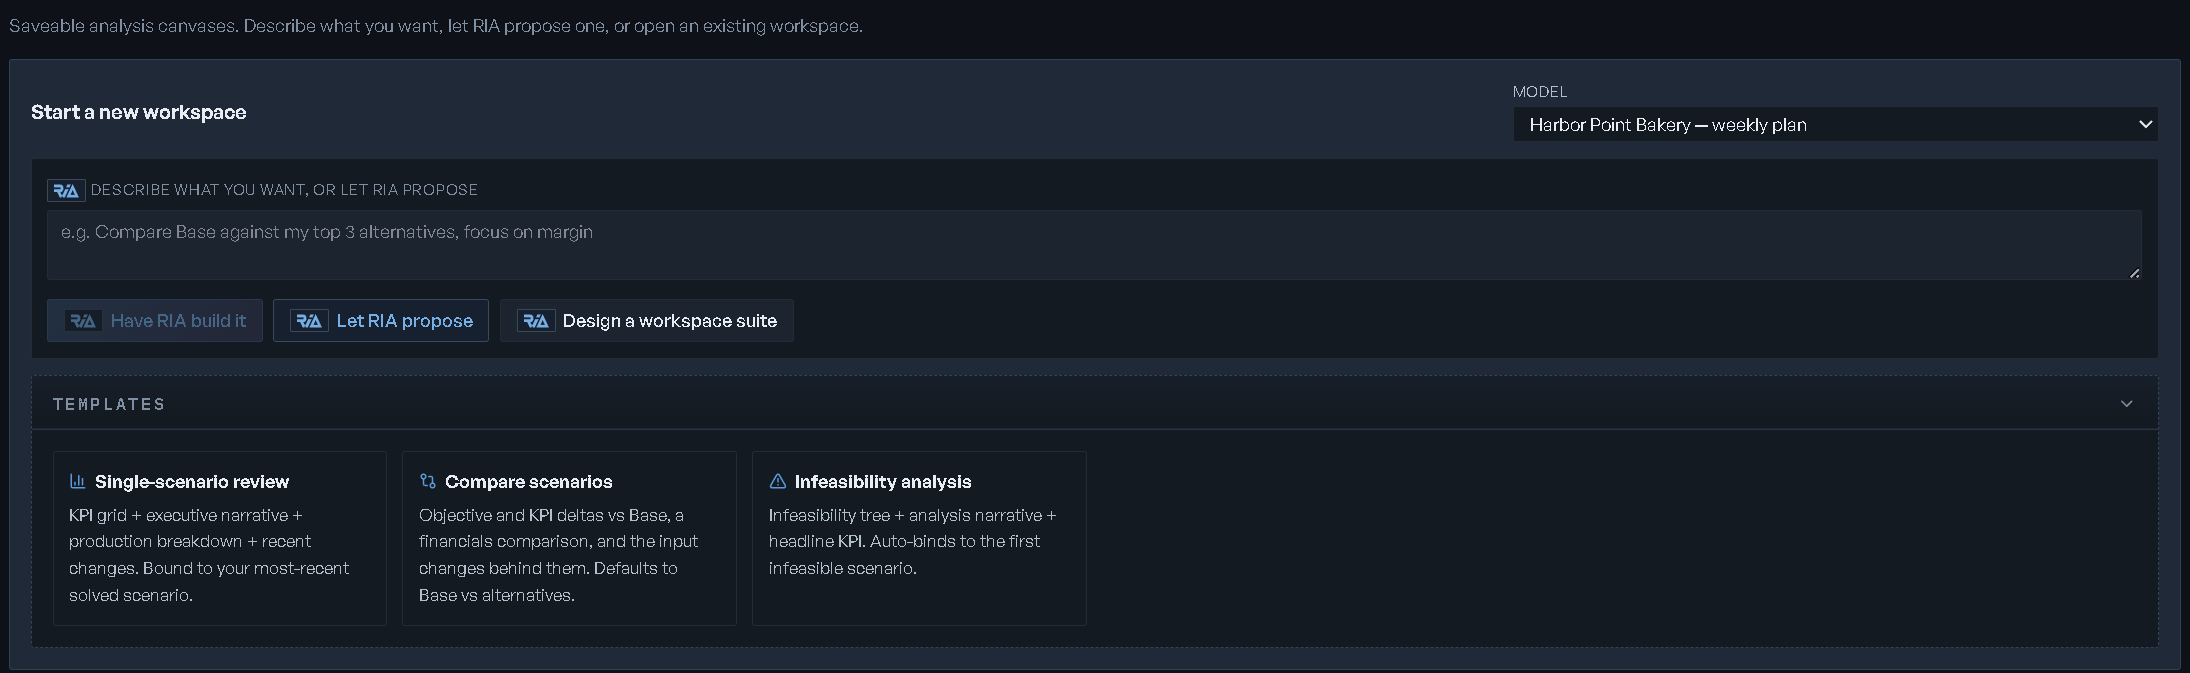
Start a new workspace holds a Model select — All models by default — and a box captioned Describe what you want, or let RIA propose. Pick a model first: with All models selected the buttons stay disabled and the panel prints Pick a model above to start.
Three buttons sit under the box:
- Have RIA build it — designs one workspace from the intent you typed.
- Let RIA propose — same flow with no intent: RIA picks the most useful workspace for the model.
- Design a workspace suite — plans a set of workspaces for the model, which you review before anything is built.
Templates is a collapsed disclosure holding three ready-made boards. Clicking one creates it:
| Template | What it holds |
|---|---|
| Single-scenario review | KPI grid, executive narrative, production breakdown, recent changes. Bound to your most recent solved scenario. |
| Compare scenarios | Objective and KPI deltas vs Base, a financials comparison, and the input changes behind them. Defaults to Base vs alternatives. |
| Infeasibility analysis | Infeasibility tree, analysis narrative, headline KPI. Auto-binds to the first infeasible scenario. |
If RIA has already planned a suite for the model, a banner reads RIA planned a workspace suite for this model. with its rationale and a Review RIA's plan button.
Below that, Existing workspaces (N) lists what you have. Pinned rows come first, then your folders alphabetically, then Ungrouped. Each row shows the workspace name, its model, its widget count and when it was updated, plus a pin toggle (Pin to top / Unpin), a folder select with + New folder…, a chip for its library tier, and a delete button. Deleting asks Delete workspace "<name>"? and states This cannot be undone.
Describing a workspace to RIA
Have RIA build it and Let RIA propose both open Build a workspace with RIA.
Fill in What should this workspace show? — the field's own example is "margins by product and
where I'm capacity-constrained" — and click Design it. Cmd/Ctrl + Enter submits too.
Watch the four steps: Reading your model's data → Designing the tiles → Binding them to your numbers → Arranging the layout, with an elapsed counter.
Review the preview. A RIA's plan card carries the rationale, a Name field holds the proposed name, and Tiles (N) lists each tile with the data source it binds to. Remove one with Drop this tile. A closing line names the data RIA had to work with.
Click Create + open. Start over discards the draft and returns you to the description; Cancel closes the dialog.
Keep at least one tile: emptying the list prints "No tiles left. Discard and try a different request." If RIA can't compose anything it says so and asks you to rephrase.
How RIA lays out a board
A board RIA composes — from Have RIA build it, Let RIA propose, or a suite — reads top to bottom. One short summary comes first, led by the plan's own numbers when the model has a solved plan. Then one KPI grid for the model's KPIs, then single figures side by side, then charts in pairs, then tables, with collaboration and decision tiles last. A figure the KPI grid already shows is not repeated in a tile of its own, and each tile is sized to what it holds.
A board for entering inputs carries no commentary: each input table gets a full-width row of its own, one under the other.
Designing a whole suite
One board answers one question. Design a workspace suite plans up to six boards for a model, then lets you cut them down.
While the first pass runs, the studio narrates Profiling this model's data → Drafting the suite with RIA → Validating against the data, with elapsed time and a stated ceiling. Composition runs on the server: you can close the window and the plan is there when you come back.
The plan header carries the rationale for the suite as a whole, with any data gaps underneath in warning text — you see what the plan can't cover before you build it.
Each planned board appears in the left rail with its name, its intended audience and its purpose. Two honest labels show up there:
- needs a solve: — the board is planned but can't be composed until a scenario is solved, with the reason attached.
- skipped: you already have a workspace with this name — a name collision, dropped rather than duplicated.
Select a board to edit it in the detail pane. There are two different controls, and they act at different levels:
| Control | Scope |
|---|---|
| Skip / Include | The whole planned board. Toggle it back and forth freely. |
| Drop this tile | One tile row inside the board. There is no undo — Regenerate this workspace re-composes the whole board. |
A board that failed to compose shows why, with a Retry link. Workspace name is editable before you build.
Create N workspaces builds the boards that composed successfully — it stays disabled, titled "Waiting for at least one composed workspace", until one has. Discard plan throws the plan away.
The planner works against one model's data. Select the model on the landing screen before opening the studio, not All models.
Inside a workspace
The left rail is the workspace's control surface. Collapse it with the chevron (Collapse panel) and bring it back with Expand workspace panel; drag its edge to resize it.
At the top, the switcher names the workspace you are in and lists the others, grouped under Same model and Other models. The pencil beside it is Rename workspace. Switching within the same model carries the scenario you were just looking at onto the target.
Templates for this model holds four presets, each marked · CURRENT if you are on it, OPEN › if it already exists, or + CREATE if it doesn't:
| Preset | What it shows |
|---|---|
| Scenario analysis | One solved scenario: objective, KPIs, production, recent changes. |
| Scenario comparison | Objective ladder, KPI delta matrix, per-period overlay chart, P&L by account vs Base, input diffs. Pick the scenarios in the picker bar. |
| Diagnose | Bottlenecks, the highest-value moves, penalty pressure and any goals the plan cannot meet, in one adaptive canvas. |
| Data exploration | A blank query canvas: compose tables, charts and metrics from what the model solved. |
Saved on this model lists every other canvas on the model. Below it:
- Build RCA workspace builds or refreshes a canvas tuned to the pinned scenario's diagnosis. Pin a scenario in the picker bar first — without one the button is disabled.
- New blank workspace creates an empty canvas; it asks you to Name the new workspace. This is the only blank-canvas path — the landing screen has no by-hand option.
The action buttons
| Button | What it does |
|---|---|
| Settings + permissions | Library tier and who has access. |
| Add widget | Pick a widget from the catalog and drop it on the canvas. |
| Explore data | Browse the data this scenario actually solved and drop a source on as a metric, chart or table. |
| Add widgets with RIA | Propose a fresh widget bundle from an intent. |
| Edit widgets with RIA | Tell RIA what to change about the current workspace. Needs at least one widget. |
| Suggest widgets | RIA proposes data-backed widgets, ranked, with no duplicates. |
| Describe a widget | One widget from one sentence, with a live preview. |
| Delete workspace | Removes the workspace. |
What you may do is decided per workspace, not per persona. Without edit rights the rail prints View only and every changing control is disabled with the reason "View only: you can read this workspace but not change it" — the canvas also stops accepting drags and resizes.
Under the actions, a details block lists Owner, Widgets and Updated, plus Run and Stage when the workspace is bound into a workflow run.
Working on the canvas
Tiles sit on a 12-column grid. Drag a tile by its header to move it, drag its corner to resize; both persist when you let go. A tile's menu offers what applies to that tile — switching the view between Bar, Line, Area, Pie, Table and Metric for chart and metric tiles, Compose query for the data-query tiles, Add a KPI… on a KPI grid, and Remove. Tiles cannot be renamed; only the workspace can.
An empty canvas says "This canvas is empty" and offers + Add widget and Add widgets with RIA.
The Run chevron above the picker bar is the canvas's one solve trigger: it solves the bound scenario with whatever edits are saved against it, and the label flips to Solving…. Only one solve runs at a time — the button is disabled while one is in flight.
If a canvas change fails to save, a banner reads A canvas change didn't save and offers Reload. Reload before re-applying the change, so you know what persisted.
When RIA has to adjust a widget to fit your data — an unsupported view swapped, a chart capped — it says so in an Adjusted to fit your data callout on the tile. Charts and breakdowns cap at 20 rows and tables at 50; trend lines are never capped.
RIA on an open canvas
- Add widgets with RIA opens Propose workspace with RIA. Describe your intent — "Compare Base against the alternatives", "Diagnose why Plan B is infeasible" — then Generate proposal, Re-propose if it missed, Accept proposal to take it. Accepting replaces the current widgets, and saved queries on replaced widgets go with them.
- Edit widgets with RIA opens Refine workspace with RIA, which keeps the rest intact. Its
own samples: "Add a data table showing weekly sales by product", "Drop the production
breakdown", "Swap the change timeline for a binding constraint heatmap". A What RIA changed
card and a
+N new/-N removed/N preservedline show the diff before Apply edit. - Suggest widgets posts no intent at all. Suggestions arrive as chips over the canvas showing the title and a preview value; the check adds one, the X dismisses it. With nothing new to suggest it tells you to solve a scenario or try Describe a widget instead.
- Describe a widget takes one sentence — "Show spoilage by product", "Revenue by period" — and binds it to a source the model actually solved. Its promise: "Only what the model exposes is offered: never a guess." You get a live preview, then Add widget. If RIA can't bind the ask, it lists what the model does expose.
When RIA drafts a layout from the console instead, the approval card names the workspace, counts the widgets and lists anything that Couldn't be added and why, with Approve and Discard; the X in its corner also discards it. See RIA Console.
Scenario context
The picker bar is sticky above the canvas and binds what every scenario-bound widget shows.
| Control | What it does |
|---|---|
| Scenario | The active scenario. An unbound workspace falls back to Base. The X unbinds it. |
| Inspect | Opens the scenario inspector. Lights up only when the solve is infeasible or carries notes. |
| Compare: | A chip per comparison scenario. Add opens the checklist, which offers Pick top 3 by objective. |
| New what-if | Creates a what-if on this model, binds it to the canvas and opens the inspector on it. |
| Period: | Slices the per-period widgets to one period. Appears only when a widget on the canvas honours it and the solve has more than one period. |
| Slice by: | Slices by a dimension the model declares. Appears only when a widget on the canvas honours one. |
| Highlight: | Shift-click a bar to add a value; the highlight carries across widgets. A single value offers Filter to slice the whole canvas to it. |
| Fullscreen | Presentation mode — see below. |
Objective dollars appear beside scenario names only if you have turned that preference on.
Scenarios themselves — creating them, reading their results — live on Scenarios.
Presentation mode
Fullscreen hides the rail and fills the screen with the canvas. Esc or Exit fullscreen
leaves. While presenting, the left and right arrow keys page through the model's other
workspaces in the order RIA planned them, and the scenario in hand carries onto each one. Arrow
keys are ignored while you are typing in a field or a dialog is open.
The widget catalog
Add widget searches the catalog by name, kind or description and groups it into five categories:
| Category | Widgets | Examples |
|---|---|---|
| Insight | 42 | KPI card, KPI grid, Production breakdown, Infeasibility tree, Financial report, Income statement (P&L), Balance sheet, Cash flow statement, Financials comparison, Network flow (Sankey), Facility network map, Service level, Binding constraints, Period waterfall, Comparison panel |
| Data | 12 | Data table, Data pivot, Data explorer, Insight table, Change timeline, Validation checklist, Recipe explorer, Data entry |
| Narrative | 6 | Executive narrative, Narrative note, Narrative author, Solve notes, RCA cockpit |
| Collaboration | 3 | Sentiment dial, Checklist runner, Live commentary |
| Decision | 2 | What-if sandbox, Constraint relaxer |
Explore data is the other way in: it lists the sources this scenario solved, grouped by domain with a preview value, and offers the view chips that source supports — a scalar offers one chip, not seven — with its best fit styled as the primary choice. Each pick drops a tile on the canvas behind the dialog; Done closes it.
Not every widget only reports. Data entry turns a tile into an editable grid over the model's inputs — see Editing data. Defining a KPI is covered in KPIs and metrics.
A widget that has been withdrawn since a board was built keeps its slot and explains itself: "This widget is no longer available", with the replacement to add if there is one. Remove the old tile from its menu.
Sharing a workspace
Settings + permissions has two sections.
Library tier is personal or organizational. Promote to organizational gives the whole org view access — edits still need contributor or owner rights. Demote to personal hides it from the org library again.
People with access has five buckets:
| Role | What it grants |
|---|---|
| Owners | Full control, including delete and promote. |
| Contributors | Can edit widgets, layout and run queries. |
| Approvers | Sign off on workspace state. |
| Viewers | Read-only access. |
| AI agents | Service principals that can write via the API. |
Add people per bucket, then Save permissions.
Workspaces can also be bound into a workflow run as a stage analysis — Open analysis on a run stage creates one from the Scenario analysis preset and files it against that run and stage.