Site Planner
Place distribution sites on a map from your own demand, compare site counts, and turn a move into a what-if on your model.
Site Planner answers two placement questions from one map: how many distribution sites you should run, and where each one should sit. You load demand, choose a range of site counts, and the planner solves one design at each count so you can compare them.
Site Planner is enabled per deployment. If Site Planner is not in the left rail, ask your account admin to enable it.
Open the planner
In the left rail, under Tools, click Site Planner. The command palette entry is Go to Site Planner.
You can also start from a model: on the Scenarios screen of a network model, the Site planner button opens the planner with that model already bound. The same link is on the site advisor widget in a workspace — Open site planner.
The welcome screen
The first time you open the planner you land on a welcome screen that explains what it does — a scrolling walkthrough of how sites move toward the demand they serve, how designs at different site counts compare, and what the planner is tested on. Open the Site Planner → goes in; Skip the intro → does the same from the foot of the page.
Show this welcome screen decides whether it comes back: Every time, First visit only (the default), or Never. Picking Never notes that "You can still open it any time from the command palette."
Plan from a demand file
The planner opens on three columns: the controls on the left, the map in the middle, the results on the right. The control rail carries the steps you are working through — Load demand, Design, Place sites.
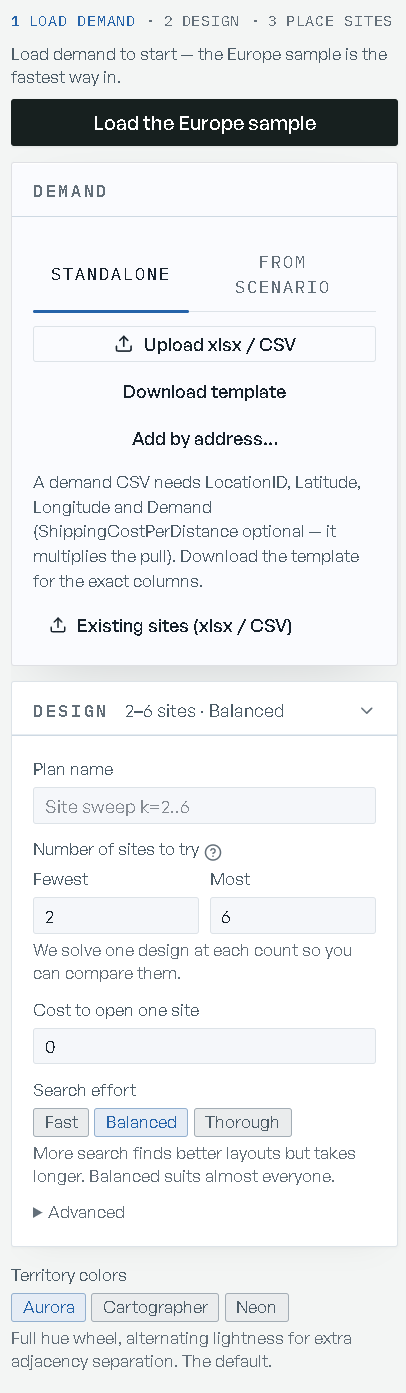
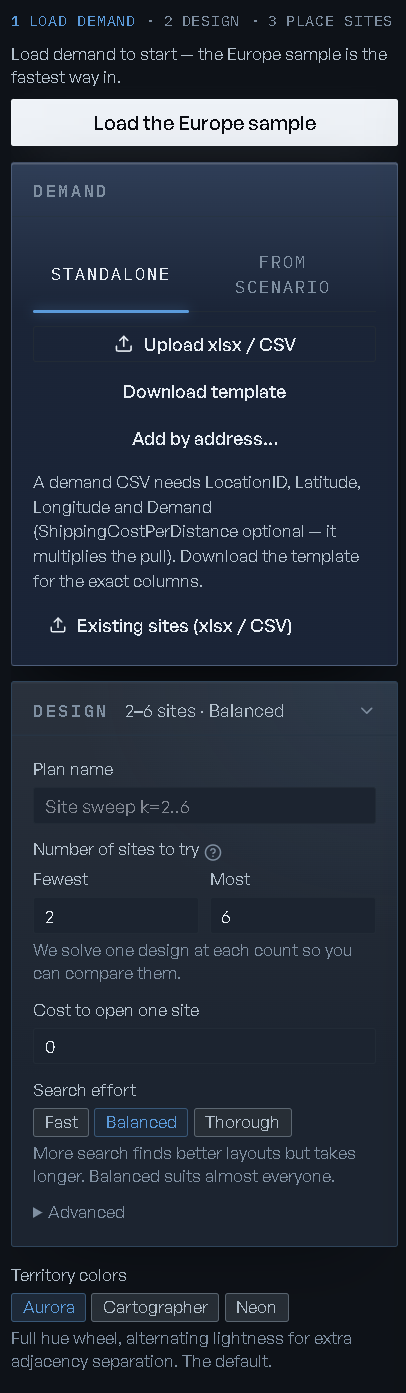
Load demand
In the Demand zone, Download template gives you the exact columns, as an .xlsx workbook
or a .zip of CSVs. Fill it in and Upload xlsx / CSV.
A demand file needs LocationID, Latitude, Longitude and Demand.
ShippingCostPerDistance is optional and multiplies that location's pull. Once the file is read,
the rail reports how many rows and unique places it found, and how many it skipped.
No coordinates? Add by address… looks them up for you to review before they become demand — see Locating by address. To watch the planner work before you bring your own numbers, Load the Europe sample.
Already have facilities? Existing sites (xlsx / CSV) loads them as the supply side. Two controls appear once it is loaded: the checkbox Start from the existing sites, and Pull sites toward.
Set the design
The Design zone opens itself when demand loads.
- Plan name — what the saved run is called.
- Number of sites to try — Fewest and Most, anywhere from 1 to 12. The planner solves one design at each count in that range, so you can compare them. Defaults are 2 and 6.
- Cost to open one site — a fixed cost per site, applied to every design. Default 0.
- Search effort — Fast, Balanced or Thorough: "More search finds better layouts but takes longer. Balanced suits almost everyone." Balanced is the default.
- Pull sites toward — Demand, Combined or Supply, shown once an existing-sites file is loaded. Note that "Weighting by supply uses your sites as pull points, not fixed anchors."
- Territory colors — Aurora (the default), Cartographer or Neon. A map choice, not part of the design.
Advanced holds the rest: Trials (1 to 32), Repeatable result (leave it empty for a random start), Starting layout (Smart spread or Farthest-first), Units (km or mi) and Distance model.
Distance model is Straight-line or Road (approx). Straight-line is the default, and in that mode a Road-distance uplift control appears: Off (straight-line) or Road-approx (×1.3), which scales straight-line distances up to stand in for road miles. Road (approx) measures on an approximate road graph instead — heavier, capped at roughly 8,000 demand points, and it runs at a fixed search depth, so Search effort does not apply.
Place sites
Place sites solves the sweep. The map header shows Solving, then Solved — or Failed or Cancelled — and a progress chip names what the run is working on. Cancel stops it. Errors appear in a strip you can Dismiss.
Read the results
The Results column leads with a verdict — for example "Open 5 sites. Total cost falls 8.3% vs 4 sites. This is the recommended design." — followed by one driver line saying how much of your demand sits within a distance band of those sites. Under it, one row per site: its id, its share of demand, its cost, and a Locked pill where the site is held in place. Selecting a row selects the site on the map, and the other way round.
Ten cards below carry the analysis, each collapsing to a one-line verdict:
| Card | What it answers |
|---|---|
| Executive summary | The design in a paragraph, with what the distances are and are not |
| Coverage | How much demand sits inside the service band |
| Coverage by site count | How coverage moves as you open more sites |
| Site schedule | The designs, count by count |
| Service level by site | How many sites cover 90%+ of their volume inside the band |
| By segment | Demand split by segment |
| Channel mix | Demand split by channel |
| Current vs proposed | The new footprint against the existing sites you uploaded |
| Pull comparison | The same demand solved toward customers, toward supply, and balanced |
| Assumptions | Distance model, pull, effort, unit and repeatability for this run |
Pull comparison runs its own solves: Compare pulls solves the demand three ways so you can see the inbound-against-outbound trade-off, and Re-run comparison repeats it. It needs an existing-sites file to compare against.
Read the figures as what they are. The Assumptions card states it in the run's own terms: distances are a units-by-distance proxy, and the fixed cost per site is a modelling input rather than a real facility cost. Dollar cost, inbound and outbound freight, and service constraints come from your model, not from the planner.
Work the map
- Test a position arms the map; the button becomes Click the map, and your click rescores the current design with the selected site moved there. Dragging a site marker does the same in one gesture. The headline stat shows Test position with the delta until you Clear test.
- The dock under the map plots cost against site count and marks the recommended design (Recommended: N sites). One pill per solved design switches the map to it.
- Replay walks through the cycles the placement went through, Pause holds it, and the
scrubber steps cycle by cycle with a
cycle N of Mreadout and the cost at that cycle. With reduced motion on, autoplay is off and the scrubber still works. - Ghost N sites overlays the design you were looking at before as open markers, so you can see what moved.
- Traffic overlays live road traffic on the basemap. It is off by default.
- Map key names what is on the map: the service area colored per site, customers sized and brightened by demand, each site in its area's color, and locked sites.
Export a design
From the map dock: Site locations (CSV), Customer assignments (CSV), and Board PNG — a light, board-ready image of the map plus the headline numbers. The results column carries Export site locations for the same locations file.
Saved plans
Every run is saved under Recent site plans, which appears once you have one. A row offers Open this run on the map, Rename this run and Delete this run.
Plans are private to the person who ran them. A colleague's plan shows an owner pill instead of a rename control: only the owner can rename a plan, and only the owner or an organization admin can delete one.
Plan from a solved scenario
Switch the Demand zone to From scenario to work from a model instead of a file. Pick a Model — only network models with located facilities are listed — and a Scenario; only solved scenarios are offered.
A Question control then asks which of two jobs you want:
- Move signal reads the scenario's solved freight and tells you how far each of your current sites sits from where that freight pulls it. It places no new sites.
- The redraw choice runs a fresh sweep on the scenario's demand and renders it exactly like a standalone run — same map, same dock, same results cards — then lets you relocate a facility to one of the new sites.
Weighting decides what the read is weighted by: Flow, Cost, or — in Move signal — Opportunity, which weights each lane by the value of one more unit there.
Move signal
The Move signal panel shows a reliability pill — Exact or Estimate — and one row per facility with the distance and compass direction it wants to move, plus a sentence saying what to do about it. Below each row is the decomposition: which counterparties pull it, and how far each one pulls. Compute exact re-solves for an exact read when the panel is showing an estimate.
Moves under 25 km are inside the noise floor and are reported as well placed — the planner does not offer to act on them. Above that, Apply move turns the signal into a real what-if. The dialog names the facility and the suggested position, previews the affected lanes (Lane, Counterparty, Cost / unit, Becomes), and says plainly what the number is: "Not a dollar forecast: each lane's own cost anchors the scale." Create the what-if lands it as a scenario on the model and takes you to that model's Scenarios screen.
Relocate to a swept site
After a redraw, the panel asks Relocate which DC?, tells you how far the nearest new site is from the facility you picked, and offers Relocate to nearest site. It rescales that facility's lane freight by the distance ratio and re-solves, through the same Create the what-if confirmation as Apply move.
Locating by address
Add by address… turns place names and street addresses into coordinates, and it proposes
rather than commits. Paste locations one per line — optionally , demand after each — press
Add, then Geocode all. Every lookup lands in a review table beside a map preview before
any of it becomes demand.
| Column | What it tells you |
|---|---|
| Location | What you typed. Editable — "Edit and press Enter to re-search" |
| Matched | What the lookup found. An ambiguous input offers every candidate in a picker rather than choosing for you |
| Demand | The demand value for this location |
| Source | Which lookup answered — Offline, Azure, or Manual for a coordinate you pinned or typed |
| Confidence | High, Med, Low, N matches, No match, Service busy - retry, Edited or Filled on save, plus what kind of place matched (address, street, city, country, place). A Check pill flags a location far from the rest of the cluster |
| Lat / Lon | The coordinates, editable if you would rather type them |
Pin drops that location on the map preview — Click map… while it is armed — so a misplaced coordinate is obvious before you commit.
Two lookups run. Offline is free place-name matching and runs first. Azure resolves street addresses and is paid per lookup — Look up N with Azure sends the rows that need it. Use offline for cities and regions; reach for Azure when you need street-level precision.
The commit bar tallies the state of the table — matched, ambiguous, no-match, to check. Accept remaining N takes the rest as they stand, Export downloads the reviewed rows as a file, and Use N as demand loads them into the planner.
Limits
| Limit | Value |
|---|---|
| Upload size | 64 MB |
| Sites per design | 1 to 12 |
| Trials | 1 to 32 |
| Demand points in Road (approx) mode | About 8,000 |
| Move signal acted on | 25 km and above |